

Schumann Resonance Today – Latest Image Main Graph
Dependencies of Amplitude
Dependencies of Quality
Dependencies of Frequency
(click to enlarge)
Schumann Resonance Today
May 24 2020 – 17:00 UTC
Schumann Resonance Recap Images
⚡️ SR May 24 – Frequency drop was temporary…
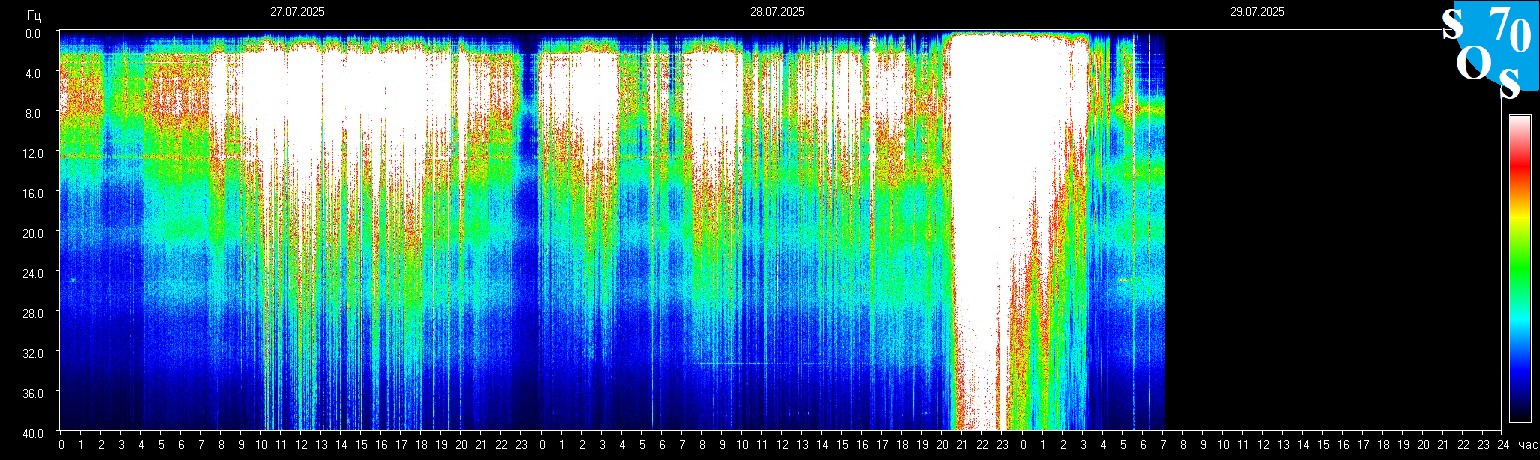
Schumann Resonance Today. We will try to keep you updated about the variations of the Resonance with this page. The great variations that nobody can explain but that give us a clear sign that the planet is changing. The Earth is vibration higher and higher, just like us!
The Chart time is based on Tomsk – Russia – UTC (Universal Time Coordinated) +7 – Source
SR Base Frequency 7.83 Hz. – Schumann Resonance Today’s Peaks
47
Amplitude
6.10
Quality
8.03
Frequency Max
7.47
Frequency Min
31
Ampltude A2
20
Ampltude A3
16
Ampltude A4
“Every second, a multitude of pulses travel around the world in this unique, resonant chamber between Earth and the ionosphere, sending colluding signals to all microorganisms. These signals couple us to the Earth’s magnetic field. Named after their discoverer, these Schumann Resonances (SR) drive the harmonizing pulse for life in our world.” Eric Thompson

Tell Us What You Feel!
How to Read the Graphs

5/24 17:00 – After the activity previously reported, the peak at Power 47 at 7 UTC followed by a minor movement that reached Power 24 at 8:30 UTC, the situation returned calm. This until 15 UTC when the Frequency has started to decrease until it reached 7.41 Hz at 16:30 UTC. This decrease can be seen in the main graph with the most intense coloring in the last hour. We will see if this decrease will lead to Amplitude’s movements or will be temporary.
5/24 08:00 – After about 18 hours of total calm, at 6:30 UTC today, suddenly, the frequency had a drop from 8.03 Hz to 7.47 in 40 minutes, this gave way to a strong variation of amplitude that at 7:30 UTC reached Power 47; we could paraphrase this event as a person who is trotting at short (Amplitude) and frequent (Frequency) steps who suddenly changes pace to a reduced frequency but with large strides (Amplitude).
5/23 17:00 – Even today we can say that it was not a real calm day, there were some short-lived isolated peaks, Power 17 shortly before 7 UTC and Power 12, lasting about an hour, from 10 to 11 UTC. Some wide fluctuations in Quality, without reaching high values, colored the main graph between 2 and 4 UTC. Frequency remained much of the time around the base value with a slight drop towards the end of the graph.
5/22 17:00 – An isolated peak, lasted about an hour, occurred from 15 to 16 UTC reaching a maximum value of Power 32 and coincided with a decrease in Frequency down to 7.54 Hz. It returned immediately afterwards towards values normal. Today, however, there has never been a real calm, various parameters have oscillated, the one that has had the most movements is the Frequency.
5/22 14:00 – Not much to report today, mainly there was no calm but not even significant activity, slight Amplitude fluctuations with a maximum at Power 10 at 7 UTC, calm in Quality apart from the first hours of the day and Frequency that oscillates around the base value.
5/21 20:00 – The scale of the Amplitude graph has changed and we clearly see that the maximum peak today was Power 50; the activity is continuing with more marked fluctuations also in Quality, the Amplitude has reached Power 21 at 19 UTC while the Frequency is in a phase of constant and gradual decline that has started many hours back, from the past midnight UTC, it has now reached the minimum value recorded today of 7.44 Hz.
5/21 17:00 – A more intense phase of activity began just before 16 UTC and in a few minutes brought the amplitude to today’s maximum peak of Power 51. With the new graphs we will be able to see more exactly how much it has reached given the very small scale of these of today. The frequency continues to remain low around 7.50 Hz.
5/21 15:50 – Moderate activity began at 13 UTC when the Frequency embarked on a slow descent to return, as previously, to 7.50 Hz. This set in motion the Amplitude that has risen above Power 20 from 13:30. UTC with a first Power 28 which was followed by another at 2. At the time of this update, the Frequency started a rapid rise with a consequent decrease in Amplitude.
5/21 09:30 – The new graphs show a situation of slight movements, in the Amplitude graph they are of little entity due to the very large scale, the two movements that are noticed have reached Power 15 at 4 UTC and Power 12 at 8 UTC. The Frequency oscillates around 7.70 Hz moving downward at the time of this update.
5/20 17:00 – The situation has calmed down considerably but the Frequency remains low, around 7.50 Hz.
5/20 13:00 – The first period of activity today lasted about 2 hours, from 4 to 6 UTC and the maximum value of Amplitude was Power 42; the second period also lasted about two hours, from 9:30 to 12 UTC and the maximum value was similar, Power 43. The difference between these two periods of movement is however remarkable in terms of graphic representation as also the other measurements of the Amplitude parameter have undergone strong increases, which have not happened previously, and therefore we see intense colors of yellow, red and green. At the time of this update, the situation seems to be moving towards calm.
5/20 08:30 – After the strong period of activity there was no calm, the amplitude did not undergo great variations but the Quality and even more the Frequency continued to oscillate without interruption. The Frequency at 4 UTC began a rapid drop towards 7.30 Hz, a value on which it remained for about 2 hours and which triggered a peak in Amplitude which reached Power 42 shortly before 5 UTC. The strong oscillations of Frequency are ongoing at the time of this update.
https://www.disclosurenews.it/en/schumann-resonance-today-update/