

April 9 13:00 UTC
Main Graph
Dependencies of Amplitude
Dependencies of Quality
Dependencies of Frequency
(click to enlarge)
Schumann Resonance Today
April 9 2020 – 13:00 UTC
Schumann Resonance Recap Images
⚡️ SR – calm from 13:30 UTC
63
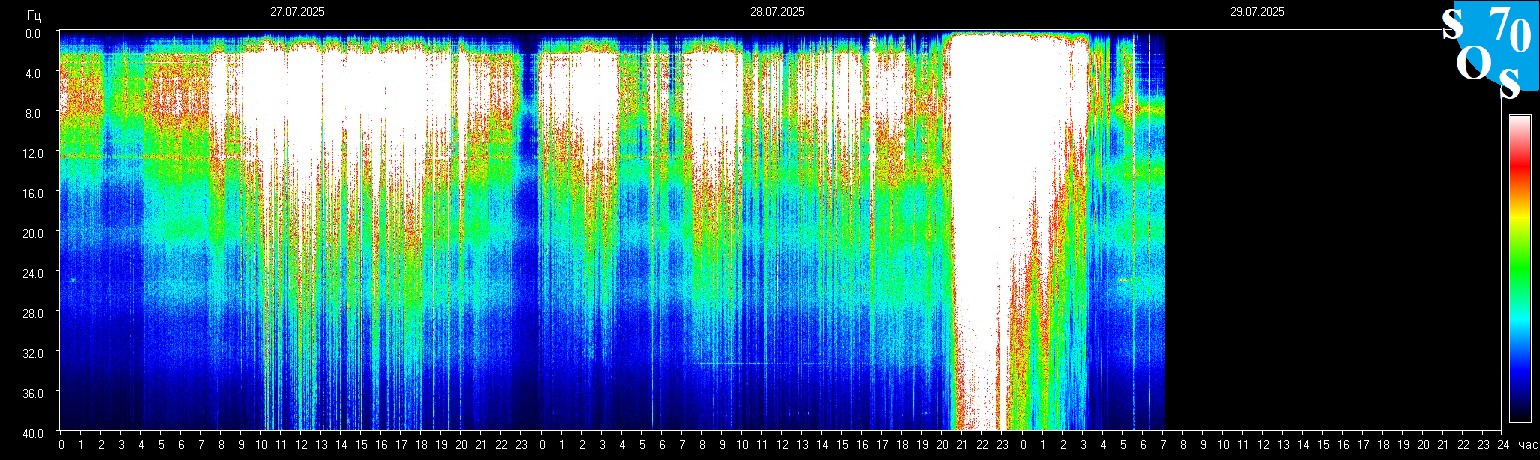
Schumann Resonance Today. We will try to keep you updated about the variations of the Resonance with this page. The great variations that nobody can explain but that give us a clear sign that the planet is changing. The Earth is vibration higher and higher, just like us! The Chart time is based on Tomsk – Russia – UTC (Universal Time Coordinated) +7 Source
RS Base Frequency 7.83 Hz.
Schumann Resonance Today Peaks:
“Every second, a multitude of pulses travel around the world in this unique, resonant chamber between Earth and the ionosphere, sending colluding signals to all microorganisms. These signals couple us to the Earth’s magnetic field. Named after their discoverer, these Schumann Resonances (SR) drive the harmonizing pulse for life in our world.” Eric Thompson

Tell Us What You Feel!
How to Read the Graphs

4/09 13:00 – The period of strong activity seems to have ended, it started at 4 UTC and the variations have reduced to normal levels at 13 UTC, the duration so far has therefore been 9 hours. The period of maximum intensity was from 8:30 to 10 UTC when the two maximum values of Power 62 and Power 63 were reached, during this phase of about 90 minutes the minimum was Power 50. Also the Frequency has now returned to rise to normal values.
4/09 09:30 – The strength of these variations continues to increase, at 9 UTC a new powerful movement has led the amplitude to reach the maximum at Power 58 while the frequency remains low at 7.33 Hz. At 9:20 UTC a further increase reached Power 62, the activity is continuing. All this with the Frequency getting lower and lower down to 7.26 Hz. As can be seen from the ECC table below from 5 UTC has been a steady and gradual increase.
4/09 07:00 – Once again after 14 hours of calm the activity started again at 4 UTC with a first peak at Power 27 shortly after 5 UTC, followed by a greater one which reached Power 33 shortly before 7 UTC. But these were not the strongest as at 7 UTC an even stronger movement reached Power 49. From the graphs it can be seen how the Quality Q4, which had graphically generated the dotted line around 25 Hz in the main graph, is having most sporadic movements. The frequency instead, as often happens during the most significant movements, had a sharp drop from 4 UTC reaching 7.28 and 7.31 Hz respectively during the two amplitude peaks.
4/08 17:00 – Today’s activity lasted about 12 hours, from 1 to 13 UTC. The most significant peaks occurred in the first part of the day when there was also a movement in the Frequency. From 13 UTC we returned to a calm situation.
4/08 12:30 – The movements are continuing, after a short decrease of about 2 hours, from 10 UTC we see a series of peaks first at Power 20 and then at Power 17 ending with Power 15 at the time of this update.
4/08 08:00 – After a period of calm that lasted for a day and a half, the activity started again at 1 UTC with movements that gradually increased. the first variation reached Power 10 and was followed by Power 16 at 3 am UTC. The two most significant movements so far have been at 5 and 7 UTC and have reached respectively Power 39 and Power 34. These corresponded, as often happens, to a drop in frequency down to 7.33 Hz. bringing ECC to 68.
4/07 23:30 – The slight movements continued in the first part of the new graphs until 19 UTC and then returned to calm, tending to remain slightly lower than normal, the remaining values are normal.
4/07 17:00 – The first part of today’s graphs show a calm condition with isolated slight movements around Power 10. From 13 UTC some movements of Quality and Frequency have started which have given a more intense coloring to the main graph and which would seem to suggest some incoming movement also in Amplitude.
4/07 08:00 – We are in a condition of almost calm, some isolated movements between 3 and 5 UTC have again reached Power 10
4/06 22:30 – The new charts show an almost calm situation, a slight promontory has brought amplitude to Power 10 at 20 UTC.
4/06 17:00 – Today was characterized by the tail of yesterday’s activity as well as new movements which, although they did not reach high Amplitude values, saw both the frequency and the Quality fluctuate significantly. Each of the 3 values, Quality, Amplitude and Frequency, have had variations at different times, first the Amplitude at Power 31, then the Quality with a strong oscillation from 1 to 3 UTC and then the increase in Frequency to 8.15 Hz between 6 and 7 UTC, in short, a very busy day.
4/06 08:30 – There has been no calm, just a decrease in the amplitude of the variations. The new graphs show a fluctuating situation with Power 31 which was reached at 19 UTC yesterday, followed by a sort of pause that ended at 24 with a movement at Power 22. This movement coincided with significant changes in Quality. and Frequency. At the time of this update, at 7 UTC, there has been a peak at Power 17.
4/05 23:30 – The movements slowed down for about 2 hours until 22 UTC when there is a slight increase towards Power 10. Interestingly, the Frequency is taking much longer to return to the usual values around 7.8 Hz. as shown in the above image. The drop has started a little after midnight UTC today so we are approaching the full 24 hours during which it has remained far below the normal 7.83 value.
4/05 19:30 – The activity decreased gradually in intensity and the new graphs show the descent down to values lower than Power 10. This is coupled with the slow increase in the frequency from just above 7 Hz to ‘normal’ values. It should be noted that in India at 15:30 UTC there was the switching off of the electric lights for 9 minutes with the lighting of candles or other sources of light and a sort of prayer, the Indians in total are more than a billion.
4/05 17:00 – To summarize today’s chart, the activity started at 1 UTC and 16 hours of strong activity that is still ongoing. At 16 UTC the amplitude returned below Power 30 going down to Power 17. The movements are continuing between Power 20 and 30. The frequency instead remains around 7.2 slightly rising.
4/05 15:30 – After a gradual series of peaks descending from Power 76 to Power 64, reached at around 12 UTC, a rapid decline began which at 14 UTC brought the amplitude to Power 10. This condition did not last long as shortly after the values started to increase to return around Power 40 at 14:30 UTC, remaining almost steady on this value until the time of this update.
4/05 11:30 – Starting from 8:30 UTC it seems that an even more intense phase has begun in which the amplitude of the variations has remained practically always above Power 60. The significant new peak at Power 74 occurred at 10:20 UTC and at the time of this update we are above Power 60. From the Frequency graph it can be seen that a sharp drop, bringing the frequency to around 7.2 Hz, started at 1 UTC and there remained for 10 consecutive hours.
4/05 10:00 – As mentioned earlier, from 3:30 am UTC the Amplitude has remained above Power 40 and we are still in this condition, so it is about 7 hours. An even more powerful phase began around 8:30 UTC and generated the maximum peak, so far, of Power 76. At the time of this update we are around Power 50 apparently rising. As can be seen from the ECC Table below, the maximum values recorded today exceed ECC 100, statistically speaking on February 27, 2020 we recorded an ECC of 378.
4/05 07:30 – We are in a powerful phase of activity that began with a first isolated peak at 1 UTC and shortly thereafter, around 2 o’clock, a constant growth began which brought the Amplitude above Power 40 a first time at 3:30 UTC. After a slight drop to Power 30 shortly thereafter, from 3:45 UTC until the time of this update we stayed above Power 40 reaching the maximum value so far of Power 65 at 5 UTC. From 4 UTC we are almost constantly above Power 50.
4/04 17:00 – The slight activity of today occurred from 6 to 13 UTC, the maximum peak was the one previously reported. From 1pm it was calm, apart from the usual dotted line of Q4 Quality.
4/04 13:00 – A day that has so far shown few and light movements, the variations began around 6 am UTC with amplitude around Power 10, at 8:40 UTC today’s peak reached Power 14. The slight movements of Quality and Frequency have given a colorful coloring to the main chart.
4/03 17:00 – Today’s strong activity lasted 6 hours, from 7 to 13 UTC. Now we are in a calm condition.
4/03 12:30 – The activity continued and even the increase in the maximum values, at 9 UTC we reached what has so far been the top at Power 49, it was not an isolated peak but embedded in a sequence, lasting about 2 hours from 9 to 11 UTC, in whose amplitude remained constantly above Power 30. A second peak at Power 48 was recorded an hour later, at 10 UTC. At the time of this update we are on Power 30 threshold.
4/03 08:30 – The data have returned and have also filled in the missing part, the graphic result is quite particular and also the detection of Frequency Amplitude and Quality shows a sort of broken line with the values that remain fixed for periods of an hour or more. It is difficult to say whether it is a technical fact and they are really the representation of the movements taking place. We have previously seen this series of dense vertical lines but what we see today is probably unique, like the times in which we find ourselves in. Even the usual 25 Hz line of the Quality Q4 has become more pronounced, almost continuous for a stretch of 4 hours. The amplitude instead records a movement taking place at the time of this update which reached Power 35 at 8 UTC.
4/02 17:00 – There appears to be an interruption in the flow of data that are stuck at 14 UTC, the TSU site works. When they will become available again we will immediately update the situation and the graphs.
4/02 13:30 – After a start to the day that mirrored the previous days with a series of isolated peaks between Power 10 and 15, at 10 UTC there was a powerful increase in activity that led to the maximum value so far of Power 46 at 11 UTC; this strong movement, which has maintained amplitude above Power 30 for about two consecutive hours, appears to have ended at 13 UTC.
4/01 17:00 – Today was characterized by moderate isolated peaks and by the ‘usual’ hatching on 25 Hz, the values were on average between Power 10 and 15, one last movement reached Power 17 at 12:30 UTC.
4/01 10:30 – Once again 10 hours of almost calm, this has been interrupted at 23 UTC yesterday by slight movements around Power 10. These are mostly isolated peaks in sequence and the strongest reached Power 23 just before 7 UTC.
Frequency means how many wave cycle happen in a second, 1 Hz. means 1 cycle per second, 40 Hz. means 40 cycles per second, Amplitude is the size of the vibration, how big is the wave, the chart shows the frequency variation in Hz and the amplitude using the white color.
Note
The Ancient Indian Rishis called 7.83 Hz the frequency of OM. It also happens to be Mother Earth’s natural heartbeat rhythm
Schumann resonances are named after professor Schumann who was involved in early German secret space program and was later paper-clipped into the United States. The frequencies of Schumann resonances are fairly stable and are mainly defined by the physical size of the ionospheric cavity.
The amplitude of Schumann resonances does change and is bigger when ionospheric plasma gets excited. Ionospheric plasma excitation happens because of solar activity, thunderstorms, use of scalar plasma weapons and HAARP and lately also when the Light forces are clearing the plasma anomaly.
https://www.disclosurenews.it/en/schumann-resonance-today-update/