

April 28 17:00 UTC
Main Graph
Dependencies of Amplitude
Dependencies of Quality
Dependencies of Frequency
(click to enlarge)
Schumann Resonance Today
April 28 2020 – 17:00 UTC
Schumann Resonance Recap Images
We are looking for someone able to translate from English (or Italian) to Spanish, contact us if you’re willing to help.
⚡️ SR April 28 – Light activity continuing Power 14 @11:30 UTC
Schumann Resonance Today. We will try to keep you updated about the variations of the Resonance with this page. The great variations that nobody can explain but that give us a clear sign that the planet is changing. The Earth is vibration higher and higher, just like us!
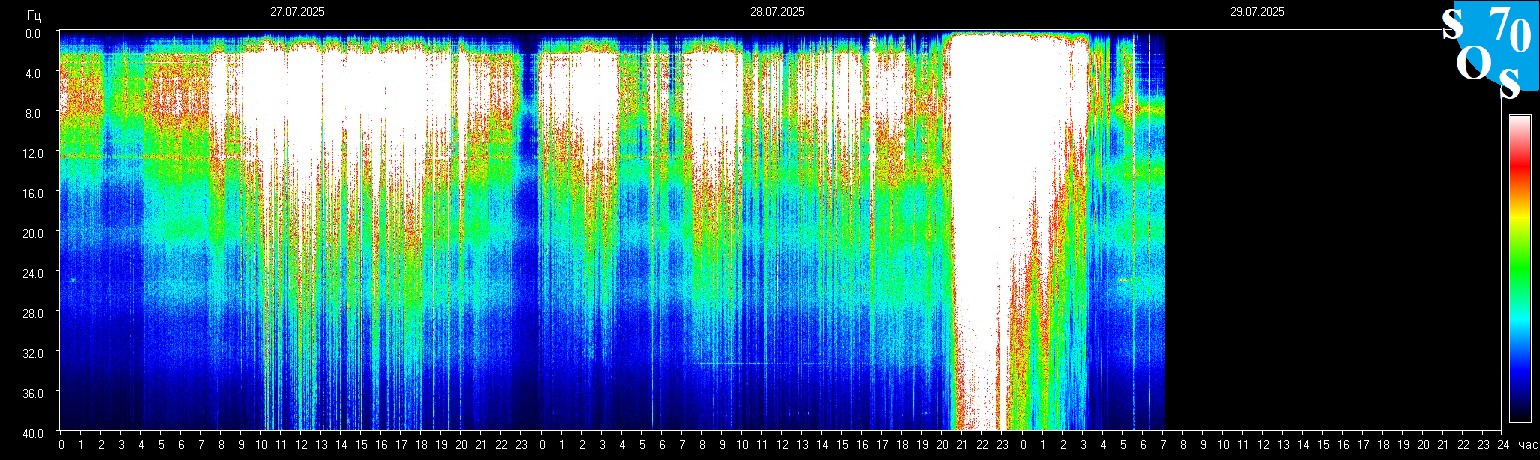
The Chart time is based on Tomsk – Russia – UTC (Universal Time Coordinated) +7 – Source
SR Base Frequency 7.83 Hz. – Schumann Resonance Today’s Peaks
18.20
Amplitude
8.90
Quality
7.95
Frequency Max
7.39
Frequency Min
10.80
Ampltude A2
6.38
Ampltude A3
7.00
Ampltude A4
“Every second, a multitude of pulses travel around the world in this unique, resonant chamber between Earth and the ionosphere, sending colluding signals to all microorganisms. These signals couple us to the Earth’s magnetic field. Named after their discoverer, these Schumann Resonances (SR) drive the harmonizing pulse for life in our world.” Eric Thompson

Tell Us What You Feel!
How to Read the Graphs

4/28 17:00 – The slight movements continued, from 8 to 11 UTC the changes in Amplitude reached Power 14 at 10 UTC, accompanied by fluctuations in Quality and a drop in Frequency down to 7.39 Hz. After these movements the situation returned calm.
4/28 08:30 – The slight movements previously reported continued sporadically, from 4 UTC the maximum values increased, albeit slightly. At 6:30 UTC we had the maximum so far which has been Power 18.
4/27 17:00 – Only very light movements in the new charts with a flicker at Power 10 just before 23 UTC.
4/27 17:00 – Aside from the Quality and Frequency movements reported yesterday, but part of today’s graphs, for the rest of the day it was total calm until 12 UTC when slight variations in Amplitude began and reached the maximum, in the form of an isolated peak of short duration, at 13 UTC with Power 24. From 14 the calm returned.
4/26 19:00 – This update is not to report a peak in Amplitude, which is below Power 10, but to highlight a strong fluctuation in Quality, which reached 14 with a steep climb at 17 UTC, and the Frequency, which at the same time saw a steep descent to 7.22 Hz. It is an isolated movement.
4/26 17:00 – Today’s activity lasted about 5 hours, from 5 to 10 UTC, the maximum Amplitude values are those previously reported, the same applies to Frequency. Now we are in a calm condition.
4/26 10:00 – Today’s graphs show an almost uninterrupted calm that started yesterday at 12 UTC and that was broken by movements that started around 5 UTC today. The variations gradually increased with a first maximum value of Power 28 at 7 and Power 30 at 9 UTC. As often happens. during this period and given the coloring of the main graph, there are fluctuations in Quality and a drop in Frequency.
4/25 22:30 – Calm.
4/25 17:00 – The activity reported previously was practically everything significant to report for today. At 11 UTC a slight movement lasting about 30 minutes reached Power 17, here the thing to note is the drop in frequency to 7.18 Hz, a very low value, this movement of the frequency lasted about 2 hours.
4/25 06:00 – Even today a strong activity but of short duration, at 3 UTC for about 40 minutes a strong peak of Amplitude reached Power 54. Compared to the peak reported yesterday, today’s one was not accompanied by significant changes in Quality, the Frequency instead has had some fluctuations even if less marked than yesterday. At 4 o’clock another movement reached Power 15.
4/24 21:30 – The activity at the turn of the local midnight, 17 UTC, was a short but intense, it lasted about an hour. After this only very light activity.
4/24 17:00 – For most of the day it was practically calm, from 14 UTC instead of medium-sized movements are noted, the first reached Power 33 at 14:30 and then returned to normal values, the second movement started at 16 UTC and has reached the remarkable value of Power 56 at the time of this update; it seems that we will see higher values shortly. In correspondence with these two movements there are strong variations in Quality and two dips at 7.23 Hz in Frequency.
4/24 10:00 – The new charts present a calm situation, a slight movement at Power 11 occurred at 7 UTC when the Quality also reached today’s maximum value at 9.10.
4/23 22:00 – The activity seems to have ended, 12 hours straight from 5 to 17 UTC, all values are back to normal and also the frequency has risen to base value.
4/23 17:00 – After a temporary decrease in movements around Power 30 between 13 and 15 UTC a new increase brought the Amplitude to Power 95 at 16:30 UTC, this brings the duration of today’s activity to 12 consecutive hours. The average over the period was Power 84.
4/23 15:30 – The Amplitude graph looks like a mountain that rises in the plain and actually today’s activity is really massive. So far, the period of activity, which is still ongoing even if at less intensity, has lasted 8 hours. At the time of this update we are at around Power 30.
4/23 11:30 – Another increase, Power 138 at 10 UTC embedded in a sequence lasting more than 2 hours in which we have always been above 120. From 6:30 UTC, when we passed Power 90, it has been a continuous increase. At the time of this update, the reading indicates Power 124.
4/23 09:30 – The very strong activity continues exceeding the previous values, at 8 UTC we had Power 124 and at 9 the situation shows a possible further increase. It is practically 2 hours that we are above Power 100. The Quality remains remains at normal values while the Frequency is low but not too much, remaining around 7.60 Hz.
4/23 08:00 – Shortly after 7:30 UTC we have reached the maximum value so far of Power 120.
4/23 07:30 – Still elevating, at 7:30 UTC we are above Power 100. The Frequency keeps dropping below 7,40 Hz.
4/23 07:00 – The situation changed markedly shortly after midnight UTC when slight isolated peaks at Power 20 and the falling Frequency trend started; from 5 UTC a powerful movement quickly and continuously brought Amplitude to Power 95. The Quality has remained at normal values while the falling Frequency has reached 7.52 Hz as minimum. The massive activity is underway.
4/22 17:00 – In the last hours, starting from 9 UTC, there has been a slight increase in movements. The amplitude oscillations, which started below Power 10, have increased, even if not very intensely, from 14 UTC to reach today’s maximum around Power 15 at 15:30 UTC. These movements went hand in hand with the decrease in Frequency, which also started at 9 UTC, which reached today’s low at 7.42 Hz at 15:30 UTC.
4/22 08:00 – The activity is continuing to gradually decrease and all the graphs show normal values, the only movement of the amplitude that stands out occurred at 3 UTC and reached Power 12. Compared to the hours at the turn of the local midnight, or 17 UTC, where we have flat calm, from the last few hours there are modest variations of the Quality that have given the main graph a green coloring. Frequency today has remained almost constantly above the base value.
4/21 17:00 – The movements previously reported have been all of today’s activity, since the last few hours we are in a calm condition.
4/21 10:00 – The new graphs show a very slight activity in the first part with oscillations that sporadically reached Power 10, from 5 UTC the movements became slightly more intense with the Amplitude that reached Power 18 a first time at 6:30 UTC. This intensification is due to a drop in frequency which has gone down to around 7.60 Hz from 6 am. From 6 to 7 UTC we have had the maximum values so far that have reached Power 19.
https://www.disclosurenews.it/en/schumann-resonance-today-update/