

Schumann Resonance Today. We will try to keep you updated about the variations of the Resonance with this page. The great variations that nobody can explain but that give us a clear sign that the planet is changing. The Earth is vibration higher and higher, just like us! RS Base Frequency 7.83 Hz.
Schumann Resonance Today Peaks:
- 4/24 – A nearly calm day, the very little activity started at 2:30 UTC with a peak to 20 Hz few minutes past 4 am UTC. This was the maximum for the day and after that the amplitude slowly returned to normal.
- 4/23 17:00 – After the strong peak reported before, the amplitude slowly subsided to normal values.
- 4/23 07:00 – After the calm day of yesterday today we see a moderate activity, the amplitude of the frequency of the Schumann Resonance has reached 40 Hz at 3 UTC remaining at that level for about an hour.
- 4/21 – Moderate activity from 1 to 10:30 am UTC. All peaks have been between 25 and 30 Hz with the greater one at 7 am UTC. After 10:30 it has been calm.
- 4/20 – Calm.
- 4/19 17:00 UTC – After an apparently calm day we suddenly had this powerful activity that started with a first peak at 35 Hz at 6 and later another at 24 Hz at 12:30 UTC and finally 1 hour at 50 Hz from 14:30 to 15: 30 UTC.
- 4/19 09:00 UTC – From today’s graph we see that yesterday from 14 to 17 UTC no data were detected, could there have been another significant peak? Today the situation has returned almost calm.
- 4/18 17:00 UTC – The TSU site seems to be frozen 3 hours ago. After the powerful peaks of this morning the graph shows a decrease in amplitude even if the activity has been continuous. We will make a new update when the charts will be available.
- 4/18 07:30 UTC – After the maximum peak previously reported, others have continued, it is not “total white” but it is a very strong activity. The peaks followed one another between 50 and 60 Hz until 2 UTC and then dropped slightly with the minimum at around 20 Hz at 4 UTC, then returned to the 40 again.
- 4/17 22:30 UTC – It start looking as another day in the 17 pattern, after the previous spike at 76 now a even more stronger peak reached 84 Hz. We are probably going to see again some major activity as predicted… will it be again a full 24 hrs?
- 4/17 22:00 UTC – A second powerful spike happened at about 22 UTC at an amplitude just little lower than the previous, probably 76 Hz. We wait now for the spike at 71 Hz.
- 4/17 19:00 UTC – A quick update to report the on the 17th of April at 17:00 UTC the spike reached 78 Hz. Would have been nicer 71 Hz. More precision needed
- 4/17 17:00 UTC – We haven’t, for now, had the powerful usual activity of the 17 but in any case it has not been a calm day, the peaks have followed one another starting from 1 UTC with amplitude between 20 and 25 Hz. The most significant peaks at 30 and 65 Hz occurred at 13 and just before 17 UTC. Is this the start?
- 4/16 – The peak of today’s graph has reached around 30 Hz and occurred at 20 UTC yesterday, the rest of the graph shows continuous movements at 15-20 Hz. For the previous two months, on each 17th the Q letter of the alphabet, we had massive activity and led someone saying that the SR could be influenced in some ways, let see if this pattern will continue tomorrow.
- 4/15 – Given the previous days, this can be considered a calm day. Today’s peaks reached 25 Hz and were at 7, 10 and 13 UTC.
- 4/17 17:00 UTC – Calm.
- 4/14 12:30 UTC – The movements have now become practically continuous. The chart shown indicates about 5 hours of “almost calm” after which the variations started again, at 17 UTC, with a series of oscillations lasted 4 hours that reached 40 Hz until to 21 UTC. These were followed by a period of about 4 hours in which the peaks were slight and then started to widen again until they exceed 40 Hz at 8 UTC.
- 4/13 17:00 UTC – Calm for now, we shall see the next few hours if there will be another movement.
- 4/13 13:00 UTC – It seems that today’s movements are coming to an end. The activity started at 2 UTC to return to almost calm at 12 UTC, the maximum peak was at 63 Hz at 5 UTC and the second, in order of magnitude, reached 57 Hz at 9 UTC.
- 4/13 08:00 UTC – After few hours of calm we are back again into moderate strong activity with a significant peak at 63 Hz happened just after 5 am UTC (noon local time in Tomsk). After this the amplitude remained mostly between 20 and 40 Hz with one more peak at 50 Hz at 7:30 UTC.
- 4/12 18:00 UTC – It seems that the powerful activity is continuing, the white continued for the last hour, the amplitude of the Resonance remained at relevant levels and than it started to fall initially below 50 Hz and lastly below 30 Hz to regain momentum and go back to 50 Hz and above.
- 4/12 17:00 UTC – The variation did not end with the previous peak, after about 2 hours where it has been above 55 Hz, at 15:30 UTC the amplitude went to 60 Hz to continue for the time until this update into very high values.
- 4/12 14:40 UTC – Minor activity started at 2:30 UTC with peak at 10-15 Hz. at 8:00 UTC there have been a slight increase and the average amplitude remained between 15 and 20 Hz. At 14 UTC we are seeing a strong increase with a spike that reached 54 Hz.
- 4/11 17:00 UTC – After four hours from the peak reported previously, in which the amplitude has continued in the variations, the situation has returned to complete calm.
- 4/11 12:30 UTC – After a period of about 10-11 hours of calm, new mild activity started to emerge with peaks moving towards 10 Hz shortly after midnight UTC. At 7 UTC amplitude oscillations became slightly more intense at around 15 Hz to culminate, shortly after 9 UTC in a powerful spike that reached 62 Hz.
- 4/10 – Even today no calm, the light activity started just before midnight UTC with peaks that reached 10 Hz. It continued on this average amplitude until the publication of this update, at 17 UTC. The only peak that stood out occurred at 4:30 UTC and reached 22 Hz.
- 4/9 17:00 UTC – Calm.
- 4/9 10:00 UTC – The activity of these first hours indicates slight movements with the amplitude that has reached 11 Hz several times. Nothing relevant.
- 4/8 17:00 UTC – Today’s amplitude remained above 15 Hz for about 5 hours, from 5:30 to 10:30 UTC, as previously reported the maximum peaks were around 25 Hz in the first hours.
- 4/8 09:00 UTC – Not much calm today, again moderate activity, so far the amplitude of the frequency, after a few hours without peaks, from 4 am UTC has returned with movements around 25 Hz.
- 4/7 17:00 UTC – After the two peaks previously reported it would seem that the Resonance has finally returned to a state of calm. Difficult, if not impossible, to make predictions but there is a latent feeling that we will still see strong movements shortly.
- 4/7 12:30 UTC – The activity is slightly diminished but not finished. In the last 12 hours two fairly significant peaks stand out, the first just after yesterday’s 21 UTC that reached almost 40 Hz, the second at 5:30 UTC today which reached around 47 Hz.
- 4/6 17:00 UTC – The intense activity continues in this sequence of days that have seen a constant and gradual increase. In these last hours there have been 3 strong peaks, 3 white pillars in the chart, which have all reached the same maximum at around 50 Hz. We will see in the next hours if the activity will have a break.
- 4/6 11:30 UTC – We are still above 40 Hz, a spike in today activity reached 60 Hz at 7:20 UTC. We are seeing medium activity that continued since yesterday, we had just few hours of calm but mainly the movements have been continuous.
- 4/5 17:00 UTC – After the 96 Hz peak the resonance frequency amplitude slowly started to go down and in about 6 hours it returned to normal levels.
- 4/5 11:30 UTC – Increased activity, after the last update in which there seemed to be a possible drop we are instead back in the “white” with a powerful spike that reached 96 Hz at about 10:30 UTC.
- 4/5 09:00 UTC – Even today strong activity, it is not common to see so many consecutive days of great variations. We’ll see if even in April, as in March and February we will have a very strong activity on the 17th (letter Q). Today the activity started with a small “introductory” peak at 20 Hz around midnight UTC and then suddenly increased to 30 Hz at 3 UTC and 80 Hz at 5 UTC. After this peak there was a gradual decrease in the amplitude and, at 9 UTC, it is at 40 HZ.
- 4/4/ 17:00 UTC – From 11:30 UTC the gradual decrease of the activity began and reached normal values at 12:30 UTC.
- 4/4 12:00 UTC – The strong activity is continuing, after the peak at 69 Hz at 7:47 UTC the amplitude of the resonance frequency has slightly decreased but it has practically remained almost always on the 50 Hz threshold.
- 4/4 08:00 UTC – New powerful activity now underway, started with a steady increase at 00 UTC this morning with peaks at 40, 55, 65 to culminate with a strong peak at 89 Hz just before 8 UTC.
- 4/3 – Moderate activity today, the copy of yesterday but of shorter duration. The movements started at 00:30 UTC to finish shortly after 10:00 UTC, within this time frame there were several peaks at 20 Hz while the two highest peaks reached 25 Hz at 5:30 and at 10:00 UTC.
- 4/2 17:00 – After the peak reported previously, the activity continued but has been waning with an amplitude of around 15 Hz down to the current calm.
- 4/2 12:30 UTC – Even today there is a fair amount of activity going on, event though the peak above 40 Hz is still missing, there have been various movements started at 4 UTC with a maximum peak so far that has reached 28 Hz at 11 UTC.
- 4/1 – After the strong peak at the beginning of the last 24 hours the activity continued but in a moderate way, there were various peaks from 5 to 11 UTC, the highest of which reached 26 Hz at 8:50 UTC.
- We added a new chart below, we’ll try to post it daily to show the actual peaks above 40 Hz.
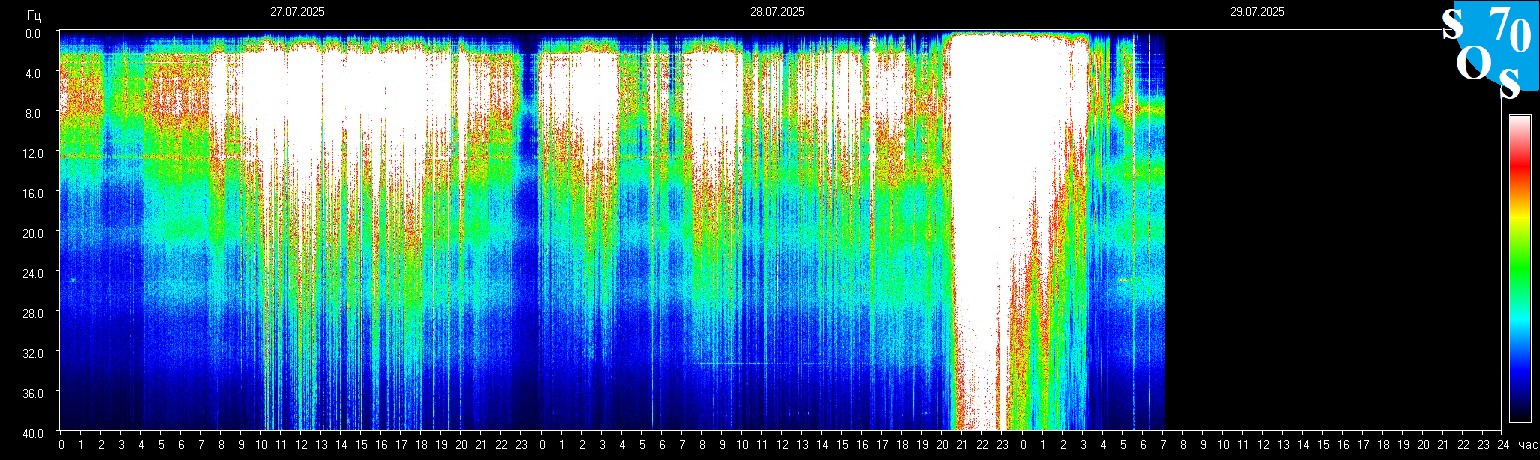
- Frequency means how many wave cycle happen in a second, 1 Hz. means 1 cycle per second, 40 Hz. means 40 cycles per second, Amplitude is the size of the vibration, how big is the wave, the chart shows the frequency variation in Hz and the amplitude using the white color.
The Chart time is based on Tomsk – Russia – UTC +7 Source