

by Gregg Prescott, M.S.
Founder, Webmaster, & Editor, In5D.com
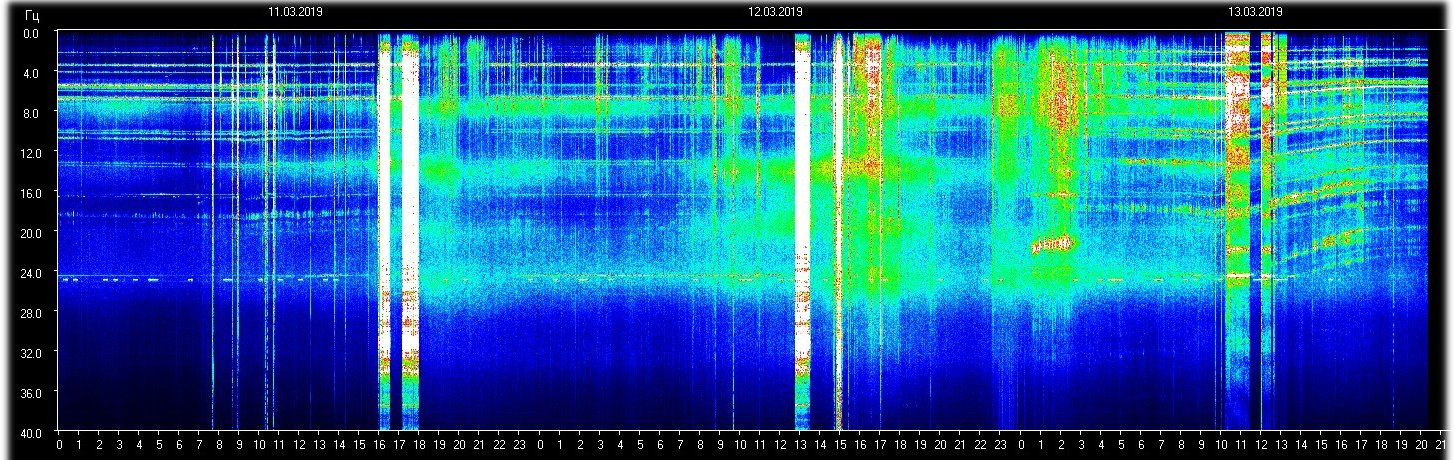
The Schumann Resonance chart (SR) has been very anomalous this month.
On March 2nd, 2019, we saw an odd curve in the SR chart:
This brought in a wave of energy that allowed for upgrades through sleep. In conjunction with this wave, many of us experienced irregular sleeping habits and felt almost forced to take naps at irregular times.
Beginning approximately on March 9th, we saw the SR charts go, basically, horizontal in their patterns.
Once again, this aligned with many people who felt exhausted and needed to sleep at irregular times. This is when many upgrades occur. You can read more about this in my article, “Bizarre! Schumann Resonance Goes Horizontal”.
Today, we’re seeing what looks like an actual wave on the SR.
Energetically, I feel like I have a lot more energy today, than since the beginning of the month.
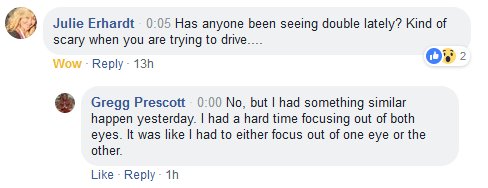
On an interesting side note, I saw a comment on my last Facebook Live video from a woman who stated, “Has anyone been seeing double lately? Kind of scary when you are trying to drive….”
My response: “No, but I had something similar happen yesterday. I had a hard time focusing out of both eyes. It was like I had to either focus out of one eye or the other.”
Related article: You’re Not Dying, It’s The Schumann Resonance!
So, I’ll put it out there because everything has a meaning to it: Has anyone else experienced vision issues?
I’m wondering if this is associated with the most recent wave. I’m also wondering if this has anything to do with the merging of the two hemispheres of our brains?
What is the Schumann Resonance and how do I read these charts?
Many people ask these questions, so you’re not alone! The SR reflects the “heartbeat” of Mother Earth. Traditionally, it has been recorded at 7.83, but we’re seen massive spikes in the chart, as evidenced by the “whiteouts” that occur. Sometimes, you may see a white spike that lasts for an hour or two, but other times, it can last up to 24 hours, or longer!
Sometimes, we see a dark, black vertical line, which may suggest some sort of reset.
What we’re looking at is the level of intensity of these waves along with anomalous patterns, as I mentioned above.
The more you follow the SR, the better you will understand what you’re seeing.
You can find the SR chart here.
Sending you all infinite LOVE & Light!
Gregg
in5d.com