

Schumann Resonance Today – Latest Image
Main Graph
Dependencies of Amplitude
Dependencies of Quality
Dependencies of Frequency
(click to enlarge)
Schumann Resonance Today
May 13 2020 – 17:00 UTC
Schumann Resonance Recap Images
⚡️ SR May 13 – Activity settled from 12 UTC
Schumann Resonance Today. We will try to keep you updated about the variations of the Resonance with this page. The great variations that nobody can explain but that give us a clear sign that the planet is changing. The Earth is vibration higher and higher, just like us!
The Chart time is based on Tomsk – Russia – UTC (Universal Time Coordinated) +7 – Source
SR Base Frequency 7.83 Hz. – Schumann Resonance Today’s Peaks
80
Amplitude
8.01
Quality
8.01
Frequency Max
7.24
Frequency Min
49
Ampltude A2
36
Ampltude A3
29
Ampltude A4
“Every second, a multitude of pulses travel around the world in this unique, resonant chamber between Earth and the ionosphere, sending colluding signals to all microorganisms. These signals couple us to the Earth’s magnetic field. Named after their discoverer, these Schumann Resonances (SR) drive the harmonizing pulse for life in our world.” Eric Thompson

Tell Us What You Feel!
How to Read the Graphs

5/13 17:00 – The four hours of activity of the UTC morning was the only movement of today’s graphs, Power 80 was however a very strong value and although short-lived, for about 20 minutes the Amplitude remained above Power 50. Note that the frequency, after these movements, did not return around the base value but has stabilized between 7.50 and 7.70 Hz while the quality has continued to oscillate, hence the coloring of the last part of the main graph.
5/13 11:00 – The maximum peak of this phase was at Power 80 reached at 10 UTC during a phase in which the Frequency started to rise again. This first phase of activity lasted 4 hours, from 7 to 11 UTC.
5/13 09:30 – The activity is continuing and the new amplitude maximum just reached has exceeded 40 reaching Power 43, the frequency continues to remain very low. On a statistical level we would like to show the graph that we used yesterday which today shows quite significant data, this to highlight that even if the data we normally use are collected in Russia the variations are on a planetary level.

5/13 09:00 – We finally found out that the problem was probably on the source website that was not updating the images, now the situation has returned to normal. The graphs show for May 12 a period of activity of about 8 hours, from 5 to 13 UTC, within which the remarkable peak of Power 52 was reached at 9, this corresponded to a peak in Quality and a minimum in Frequency. From 13 UTC an almost calm condition returned and lasted until today at 6 UTC when a series of rapid variations brought the Amplitude repeatedly above Power 30 with the maximum at Power 39 at 8:30 UTC. Also, for this activity there is a marked increase in Quality and a sudden drop in Frequency which has reached the minimum of the last few days at 7.27 Hz.
5/12 17:00 – It is difficult to make updates based on the data shown by these graphs, what can be said is that there are no relevant movements, we could say that the situation is calm. There are isolated peaks but these, due to the position of the detectors, are due to external factors and not proper to the Schumann Resonance. To return to normal data reports we will have to wait for the usual graphs to be updated. However, we will update the current chart which has temporarily replaced the usual one even if the cadence is much wider.
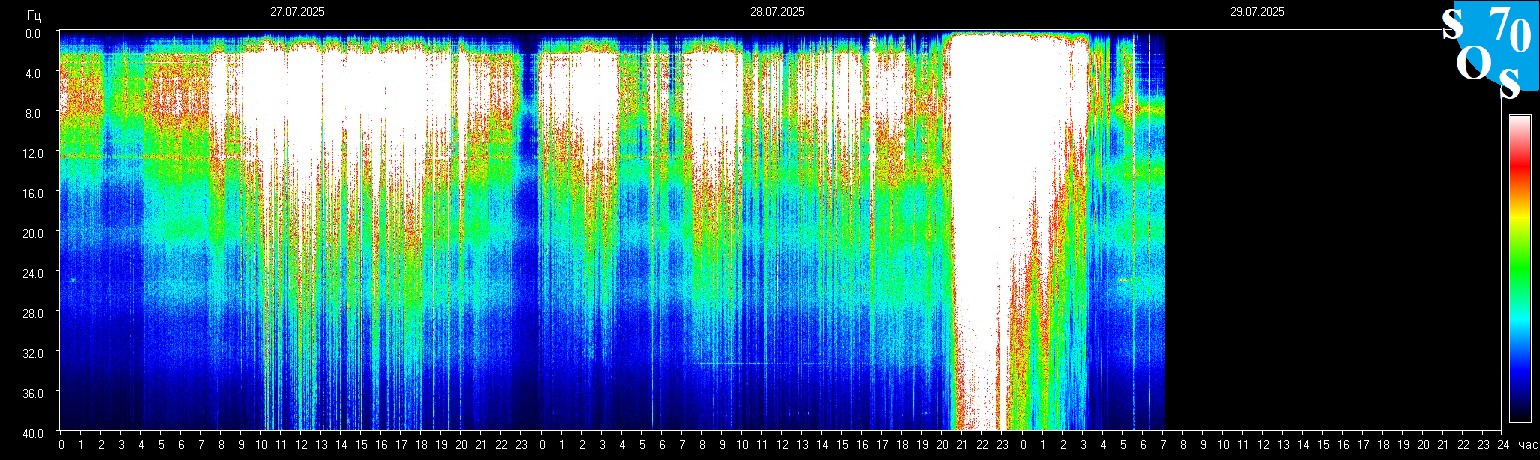
5/12 08:30 – The situation has not changed, the data is still missing and the graph is not updated, which is unusual, generally even if the data is not recorded the graph is updated, at least on the date. This time it’s not and it suggests that there are more serious problems … What we see above is, instead, an alternative data source located in Italy. The graph shows the electric field from 1 to 100 Hz, we prefer not to go into excessive explanations as higher technical knowledge is needed and we would create more questions than anything else, what is clear is that it does not seem we’re having much activity in progress in the last hours. The upper part of the image is today, the lower part is from the last days.
5/11 20:30 – Images are not being updated, we’re still stuck at the same from this morning UTC. One of the recent longest blackout was in October 2019 when it lasted more than 2 days, in 2020 there have been few, lasting generally less than a day.
5/11 17:00 – Blackout continues.
5/11 14:30 – Still in dark mode…
5/11 12:30 – The new graphs still show a calm condition even if in the last hours of the data received there have been some ripples in the Amplitude that has repeatedly reached Power 10, from 23 to 3 UTC. And at that the data transmission stopped, so it’s about 10 hours of blackout. It is also noted that from around midnight UTC the Frequency has constantly risen to high values. We will see when the data transmission will resume what the situation will be.
5/10 17:00 – The calm lasted for the whole extension of today’s graph, the only movement, excluding the previous one to Power 8 actually not very relevant, was at 14 UTC with Power 17. Nothing else to report for Quality and Frequency that remained on normal values.
5/10 08:00 – These are the images of a situation of calm, Amplitude and Quality at minimum and Frequency on the base value, we are approaching the 12 consecutive hours of flat calm.
5/09 17: 00 – Today’s moderate activity lasted about 10 hours, from 3 to 13 UTC. After the peak at Power 34 at 8 UTC another followed at 9:30 and reached Power 25 after which a slow descent began with movements around 15, normal values were reached at 13 UTC. The only parameter that has not yet returned to the base value is the Frequency which continues to tend to remain around 7.60 Hz.
5/09 08:30 – After almost two days of total calm, the activity returned to show itself at 4 UTC today with a first isolated peak that reached Power 19. This first movement was anticipated by a series of fluctuations in Quality and a gradual drop in Frequency started around 1 UTC. As these two parameters deviated from the normal values, the Amplitude also reacted and from 6 UTC it began a rapid increase that reached the maximum of Power 34 at 8 UTC.
5/08 17:00 – Total calm, all the values are back to normal.
5/08 14:00 – The almost total calm is continuing, very slight variations in Quality have given the main graph a green color from 6 UTC. The Frequency has dropped slightly to around 7.60 Hz from 9 UTC while the Amplitude has remained at minimum values.
5/08 07:00 – After several days of strong activity, in the graph of the last 3 days we can see a genera calm, apart from the 2 hours of strong activity yesterday. Today we see Power 10 at 1 UTC in a minimal movement with all the parameters on normal values.
https://www.disclosurenews.it/en/schumann-resonance-today-update/