

Schumann Resonance Today – Latest Image
Main Graph
Dependencies of Amplitude
Dependencies of Quality
Dependencies of Frequency
(click to enlarge)
Schumann Resonance Today
May 3 2020 – 12:00 UTC
⚡️ SR May 3 – Activity increasing Power 43 @7:30 UTC
Schumann Resonance Recap Images
Schumann Resonance Today. We will try to keep you updated about the variations of the Resonance with this page. The great variations that nobody can explain but that give us a clear sign that the planet is changing. The Earth is vibration higher and higher, just like us!
The Chart time is based on Tomsk – Russia – UTC (Universal Time Coordinated) +7 – Source
SR Base Frequency 7.83 Hz. – Schumann Resonance Today’s Peaks
80
Amplitude
7.30
Quality
7.92
Frequency Max
7.32
Frequency Min
27
Ampltude A2
15
Ampltude A3
10
Ampltude A4
“Every second, a multitude of pulses travel around the world in this unique, resonant chamber between Earth and the ionosphere, sending colluding signals to all microorganisms. These signals couple us to the Earth’s magnetic field. Named after their discoverer, these Schumann Resonances (SR) drive the harmonizing pulse for life in our world.” Eric Thompson
Tell Us What You Feel!
How to Read the Graphs

5/03 12:00 – Today so far it has been a continuous crescendo, after the last update we had a peak at Power 65 at 9 UTC, one at Power 72 at 10 and, like a clock, Power 80 at 11 UTC. At 11 o’clock there is a drop in Quality, part of the wide oscillations, and the Frequency which always remains at fairly low levels.
5/03 08:00 – Another increase, after the previous peak, a rapid and short drop before going back to Power 63 at 9 UTC. As before Quality in ever wider oscillations and low Frequency.
5/03 08:00 – As anticipated, the activity is continuing, it started at 3 UTC and with a slow and constant increase it reached the maximum value so far of Power 43 at 7:30 UTC. The oscillations of the Quality increased in intensity without however reaching high values while the frequency continued to decrease until it reached 7.32 Hz.
5/03 06:30 – Once again a period of calm, lasting about 15 hours, from 12 UTC yesterday to 3 this morning. All values measured during this period remained stable at basic levels. From 3 UTC there is a gradual increase in Amplitude which at the time of this update reached Power 20, this movement is accompanied by an equally increase in Quality and a less gradual decrease in Frequency which is going below 7.40 Hz. There is the feeling that the activity can continue to increase.
5/02 17:00 – Calm.
5/02 13:00 – We hope you like the constantly updated charts! Today’s situation, after the final part of the activity previously reported yesterday, shows a period of almost calm that started at 22 UTC yesterday and that lasted for about 10 hours until 8 UTC today. During this period, the Amplitude and the Frequency remained on normal values while the Quality had a variation between 3 and 4 UTC. The first isolated peak of Amplitude at 8 UTC reached Power 20, the second, still isolated, reached Power 18 at 8 UTC and the last, isolated as well, reached Power 41 at 11:40 UTC. While these peaks occurred, the Frequency, as it almost always happens, has had wide oscillations towards lower values, but not too low.
5/01 23:00 – Today we worked hard to make the way that the main chart is updated independently of these textual updates, the work is not yet finished but I think it was worth it already! As for the situation, we see that from 15 to 19 UTC the activity was powerful with 3 major peaks at Power 58, 47 and 30. A further isolated peak reached Power 34 at 21:30 UTC. There have also been wide fluctuations in Quality, indicating that the “message” has not always been the same while the Frequency has had a sharp drop between 17 and 19 UTC.
5/01 17:00 – Even today, little or no calm, after the movements described previously we had an isolated peak that reached Power 44 shortly before 12 UTC. In the following 3 hours there were fluctuations in Quality and Frequency but the Amplitude remained at normal values. From 15, however, a rapid drop in Frequency began and once again an increase in Amplitude which in one hour, at 16 UTC, reached today’s maximum at Power 58. Frequency is still very low at the time of this update so it is possible that the activity continues.
5/01 08:30 – There was the impression that the activity would have continued and it did. Resuming from the last update, where we highlighted the frequency that remained high, it remained so, with the Amplitude on normal values, until 2 UTC when a rapid drop began. At the same time, the Amplitude gradually started to rise to reach the maximum at Power 58 just before 7 UTC. This peak was followed by a new drop towards Power 20 and with an increase in frequency.
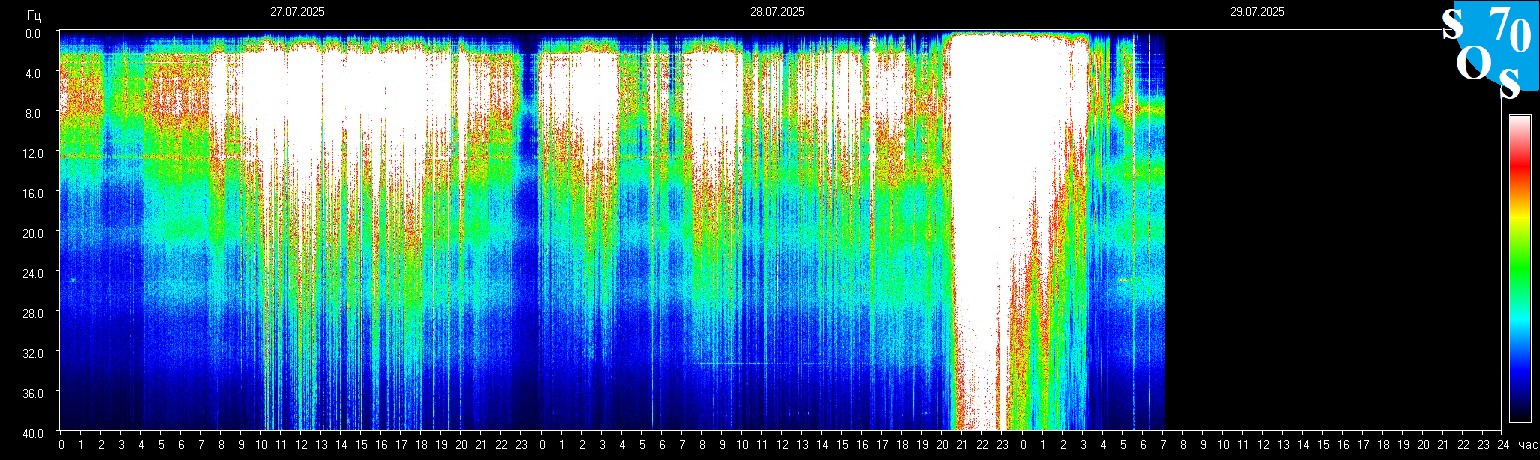
Frequency means how many wave cycle happen in a second, 1 Hz. means 1 cycle per second, 40 Hz. means 40 cycles per second, Amplitude is the size of the vibration, how big is the wave, the chart shows the frequency variation in Hz and the amplitude using the white color.
https://www.disclosurenews.it/en/schumann-resonance-today-update/