

3/9 17:00 UTC
Main Graph
Dependencies of Amplitude
Dependencies of Quality
Dependencies of Frequency
(click to enlarge)
Schumann Resonance Today
March 9 2020 – 17:00 UTC
17
Schumann Resonance Today. We will try to keep you updated about the variations of the Resonance with this page. The great variations that nobody can explain but that give us a clear sign that the planet is changing. The Earth is vibration higher and higher, just like us!
The Chart time is based on Tomsk – Russia – UTC (Universal Time Coordinated) +7 Source
RS Base Frequency 7.83 Hz.
Schumann Resonance Today Peaks:
“Every second, a multitude of pulses travel around the world in this unique, resonant chamber between Earth and the ionosphere, sending colluding signals to all microorganisms. These signals couple us to the Earth’s magnetic field. Named after their discoverer, these Schumann Resonances (SR) drive the harmonizing pulse for life in our world.” Eric Thompson
Tell Us What You Feel!
How to Read the Graphs

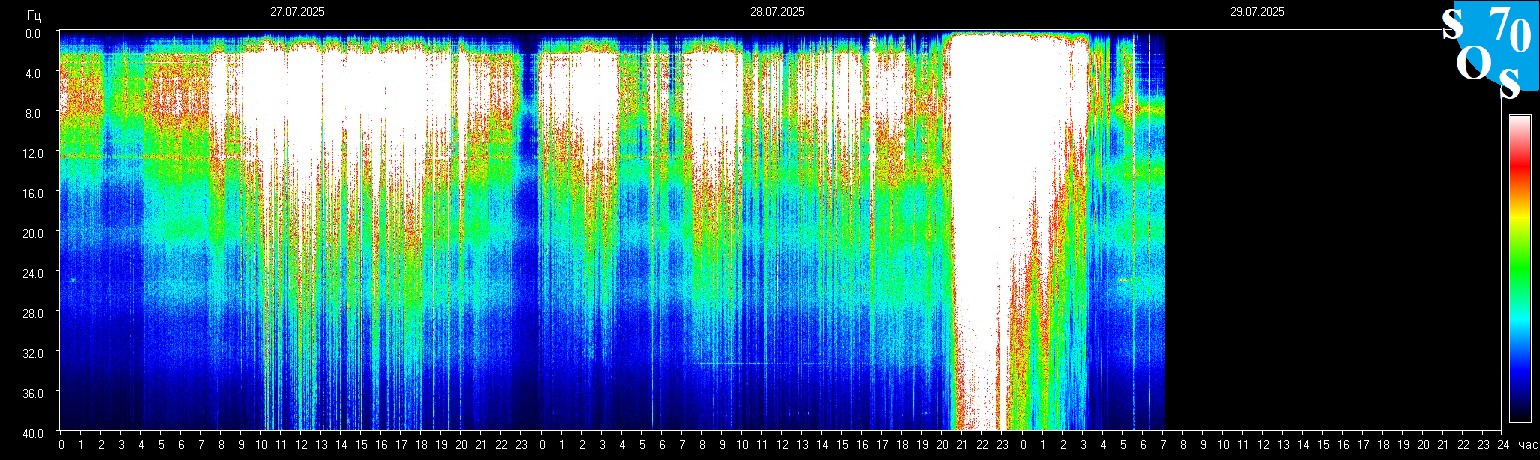
3/9 17:00 – Power 17 remained the highest value on today’s chart but there is still a slight background activity.
3/9 13:00 – The new graphs show that a slight activity has always been present for almost 48 hours. The most significant movements, so far, have started around 1 UTC when the amplitude has exceeded Power 10. Around 6 UTC there was a further increase in Power 13 and at 10 UTC we had Power 16. The crescendo is continuing and at the time of this update we are at Power 17.
3/8 17:00 – From 13 UTC the activity started to subside.
3/8 15:00 – The last 24 hours have been characterized by an average activity with the most intense part in the hours preceding midnight UTC. For the remaining part, the movements were continuous but limited around Power 10, shortly after 17 of the local timeline (10:30 UTC) there was a movement that reached Power 17.
3/7 22:00 – We had anticipated that we could have a significant activity and so it is. The rise was constant until 21 UTC when a powerful peak reached Power 41.
3/7 17:00 – Around 15 UTC started what appears to be the beginning of an activity that could become significant, the amplitude exceeded Power 10 just before 17 UTC.
3/7 13:00 – Not much to report except that the very light background movements have continued, in today’s graph we can note two isolated peaks, one at 18 UTC yesterday that reached Power 13, and one at 11 UTC today that reached Power 14.
3/6 17:00 – After a calm night (UTC), very light movements began at 3 UTC which almost cyclically brought the amplitude to Power 13 around 7 am UTC, the maximum value of today, which was repeated at 9 UTC. After these last light isolated peaks, the very slight background movements continued.
3/5 17:00 – After the last isolated peak at Power 22 happened at 13 UTC, the movements quickly subsided and we are now in a calm condition.
3/5 13:00 – The activity in today’s chart occurred in three distinct periods: from 18 to 20 UTC (yesterday) when we had the strongest peak so far at Power 36; around 1 UTC with the maximum of 29 Power; from 9 to 11 UTC with various movements that had the maximum at Power 22. If we analyze the three line graphs we see that the strongest peak, in terms of ECC, was that at 8 where we see significant variations in quality and in frequency, the value is 59.
3/4 20:30 – The slight movements that we saw at the passage of the new chart were the preamble to a series of significant spikes that started around 18 and in a few minutes brought the amplitude to Power 26, which was followed, about an hour later at 19:30 UTC, by a further increase to Power 36.
3/4 17:00 – Minor movements around Power 10 continue.
3/4 09:00 – The calm period lasted about 20 hours, from little after midnight UTC some slight movements started and reached the maximum at Power 9, from 5 UTC the values slightly increased up to Power 11. Looking at the frequency graph we see that it is actually in a downward peak, possible indicator of more powerful activity.
3/4 00:00 – The total calm in which we are in has lasted for more than 12 hours.
3/3 17:00 – The last two isolated movements, before the calm, occurred at 9 and 11 UTC reaching Power 9.
3/3 10:00 – In the new main graph we see a series of very close vertical thin lines that begin shortly after midnight UTC and from 6 am start to fade out. The peaks have been of moderate values, so far the maximum has been Power 13 just before 4 UTC. It can be noted, once again, how the movements that have the most ‘chromatic’ impact on the graph are those that have seen changes also in the Quality.
3/2 17:00 – Other minor movements in the latter part of the day around Power 10 occurred between 9 and 12 UTC, after which it was calm.
3/2 09:00 – Today’s chart shows a calm condition until 1 UTC when few slight isolated movements started, they occurred over a 8 hours hours period, until 9 UTC. The maximum value reached was Power 21 at 5 UTC, this specific movement saw frequency and quality oscillations, in addition to the amplitude, and the ECC value was 43.
3/1 17:00 – Today’s graphs show two different types of activity, one given only by the Amplitude, identified by the isolated white lines, and one given by the other parameters, with various colors of green yellow and red. Today’s periods of greatest activity do not correspond to the maximum amplitude peaks, which reached Power 10 just before 1 UTC. The most intense, relatively speaking, part instead took place from 20 to 21 UTC yesterday.
Frequency means how many wave cycle happen in a second, 1 Hz. means 1 cycle per second, 40 Hz. means 40 cycles per second, Amplitude is the size of the vibration, how big is the wave, the chart shows the frequency variation in Hz and the amplitude using the white color.
Note
The Ancient Indian Rishis called 7.83 Hz the frequency of OM. It also happens to be Mother Earth’s natural heartbeat rhythm
Schumann resonances are named after professor Schumann who was involved in early German secret space program and was later paper-clipped into the United States. The frequencies of Schumann resonances are fairly stable and are mainly defined by the physical size of the ionospheric cavity.
The amplitude of Schumann resonances does change and is bigger when ionospheric plasma gets excited. Ionospheric plasma excitation happens because of solar activity, thunderstorms, use of scalar plasma weapons and HAARP and lately also when the Light forces are clearing the plasma anomaly.
Show
entries
Search:
Time UTC +7AmplitudeQualityA+QFreq.Base Freq.DeltaECC IncreaseTOTAL ECC08/03/2020 17:30:00 17 5 22 7,41 7,83 0,42 9,24 31,24
08/03/2020 21:30:00 41 7 48 7,4 7,83 0,43 20,64 68,64
04/03/2020 16:00:00 22 5 27 7,33 7,83 0,5 13,5 40,5
04/03/2020 08:00:00 28 12 40 7,34 7,83 0,49 19,6 59,6
04/03/2020 02:30:00 36 5 41 7,62 7,83 0,21 8,61 49,61
01/03/2020 8.00.00 10 5 15 7,73 7,83 0,1 1,5 16,5
01/03/2020 4.00.00 8 6 14 8,03 7,83 0,2 2,8 16,8
29/02/2020 9.30.00 23 7 30 7,52 7,83 0,31 9,3 39,3
28/02/2020 16.00.00 26 8 34 7,28 7,83 0,55 18,7 52,7
28/02/2020 0.30.00 34 5 39 7,83 7,83 0 0 39
Showing 1 to 10 of 22 entries
PreviousNext
Schumann Resonance ECC
Amplitude Quality Frequency
Schumann Resonance PDF Archives
Read and Download
Schumann Resonance Differential Peaks
Read
Images Archive
All the SR daily images in one single page
See the Images

Explanation of The Chart
The Schumann Resonance Spectrogram Char
The Schumann Resonance Chart displays data from the magnetic field detector to monitor the resonances occurring in the plasma waves constantly circling the earth in the ionosphere. These three days spectrograms show the activity occurring at the various resonant frequencies from 1 to 40 Hz. Within the spectrogram, the power, or intensity level of each frequency is displayed as a color, with white being the most intense. The Schumann Resonances appear as the horizontal lines at 0.0, 4.0, 8.0, 12.0, 16.0, 20.0, 24.0, 28.0, 32.0, 36.0 & 40.0 Hz. This chart is based on Tomsk, Russia, time UTC +7 (UTC = Universal Time Coordinated).
What is a Spectrogram?
The Spectrogram Calendar is a visual representation of the range of frequencies in the magnetic field at a given location. Similar to how an equalizer displays the frequency content of music played on your stereo, the spectrogram calendar displays the frequency content of a magnetic field. Instead of showing a brief snapshot, it shows changes over a period of time, in this case 3 days.
The local magnetic field is a dynamic field that changes constantly because of variations in the ionosphere and sun and many other influences not yet fully understood. The range of variation displayed in the spectrogram chart is from 0 to 40 cycles per second. The vertical axis is frequency and the horizontal axis is time. The amplitude of a particular frequency at a specific time is represented by the intensity of color (green, yellow, white) of each point in the image.

What is the Schumann Resonance?
The Herathbeat of Planet Earth
Read