

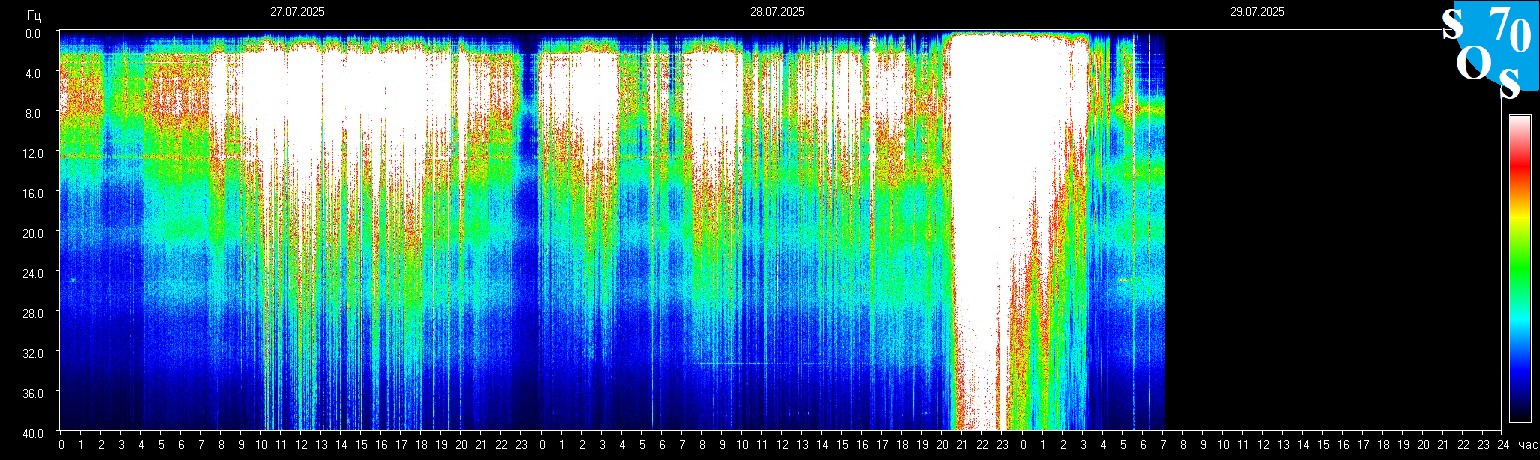
Schumann Resonance Today 3/6/2019 We will try to keep you updated about the variations of the Resonance with this page. The great variations that nobody can explain but that give us a clear sign that the planet is changing. The Earth is vibration higher and higher, just like us! RS Base Frequency 7.83 Hz.
Schumann Resonance Today Peaks:
3/7 17:17 UTC – Just another spike on top of the previous report, it has been at 20 Hz. at 15:30 UTC.
3/7 8:50 UTC – Well, we all knew that days of great movement awaited us and here is one; relentlessly since the last report the increase in movement has spiked considerably with this massive peak at 89 Hz. at around 8 UTC. It was preceded in the night at 3:30 UTC by another strong at 50 Hz. We have the feeling that it could probably continue in this way until the Spring Equinox.
3/6 – After the peak at 61 Hz, which we reported in the previous update today, the activity did not stop, an additional movement at about 30 Hz occurred at 7:30 UTC. Then, at 1:45 pm and 4:45 pm UTC, another two relatively minor peaks at 20 Hz. Calm periods were not that many in the last week as shown in the updated archive.
3/6 09:09 UTC – On a day that began calmly after a long sequence of very hectic days, to remind us that something big could be happening at the planetary level, a powerful peak, which lasted almost an hour, occurred this morning between 6 and 7 UTC. Its maximum was 61 Hz.
3/5 – A day of low activity but not of calm, the peaks were slightly lower than yesterday in terms of size but lower in number. The highest peak reached 25 Hz. at 1:30 UTC. To return to the Differential Peaks, in the Dependency graph you can see that there is a detection uniformity, which did not happen on March 3rd.
3/4 – Few peaks today, they were not very powerful though, the first one was just after 17 UTC yesterday and reached 24 Hz. The second one slightly stronger was at 23 UTC close to 30 Hz. and a similar one at 9:30 UTC. The other spikes were minor but shown a kind of “pressure”.
3/3 22:22 UTC – According to P1 what we saw today, reported below, were differential peaks. Probably the differential peak occurs when simultaneous amplitude differences occur on the same resonance frequency. This is our interpretation, but we ignore its meaning. See the link below.
3/3 – An eventful day, the unusual signs we see on the chart were probably caused by frequency amplitude signals that were not recorded by all the detectors. There are several peaks in the last 24 hours: the first, detected by a receiver at 4:45 UTC at 24 Hz; the second one at 5:50 UTC at 29 Hz; the third one at 24 UTC at 15 Hz; the fourth and last detected by all receivers at 28 Hz.
3/2 – After several days of strong activity and probably before some others when there could be another series of peaks, today has been a clam day. Nothing significant but if we want to find something the top of the day was 15 Hz. at 11 UTC.
3/1 – Today only one major spike, embedded in movement that did not reach 20 Hz. It has been at 8:30 UTC and the peak was a strong 50 Hz.
2/28 – The movement of the day has been the peak at a massive 85 Hz. at 7:30 am UTC, it has been anticipated, one hour earlier by a minor 20 Hz. spike. For the rest of the last 24 hours not much except a light activity near the 20 Hz. threshold at the start of the today’s chart.
2/27 – We cannot say it has been a day of massive activity but surely it has been quite strong, After the yesterday’s pillar the movements restarted at 19 UTC with few hours on the 30 Hz. average peaks and gradually decreasing the amplitude. A sudden spike took place at 9 UTC this morning reaching 64 Hz. after that no more peaks above 20 Hz.
2/26 – The last 24 hours has shown a “warm-up” peaks at 30 Hz. yesterday UTC at 23. Today, at 7:45 am, 2 hours hours on major activity that peaked twice at 74 and 70 Hz.
We added a new chart below, we’ll try to post it daily to show the actual peaks above 40 Hz.
Frequency means how many wave cycle happen in a second, 1 Hz. means 1 cycle per second, 40 Hz. means 40 cycles per second, Amplitude is the size of the vibration, how big is the wave, the chart shows the frequency variation in Hz and the amplitude using the white color.
The Chart time is based on Tomsk – Russia – UTC +7 Source
Note
The Ancient Indian Rishis called 7.83 Hz the frequency of OM. It also happens to be Mother Earth’s natural heartbeat rhythm Schumann resonances are named after professor Schumann who was involved in early German secret space program and was later paper-clipped into the United States. The frequencies of Schumann resonances are fairly stable and are mainly defined by the physical size of the ionospheric cavity. The amplitude of Schumann resonances does change and is bigger when ionospheric plasma gets excited. Ionospheric plasma excitation happens because of solar activity, thunderstorms, use of scalar plasma weapons and HAARP and lately also when the Light forces are clearing the plasma anomaly.
 Dependencies Amplitudes Schumann Resonance March 7 2019
Schumann Resonance Differential Peaks
Read
Images Archive
All the SR daily images in one single pageSee the Images

Explanation of The Chart
What is the Schumann Resonance?
The Herathbeat of Planet EarthRead

Man
Our virtues and our failings are inseparable, like force and matter. When they separate, man is no more.
Nikola Tesla
https://www.disclosurenews.it/en/schumann-resonance-today-update/